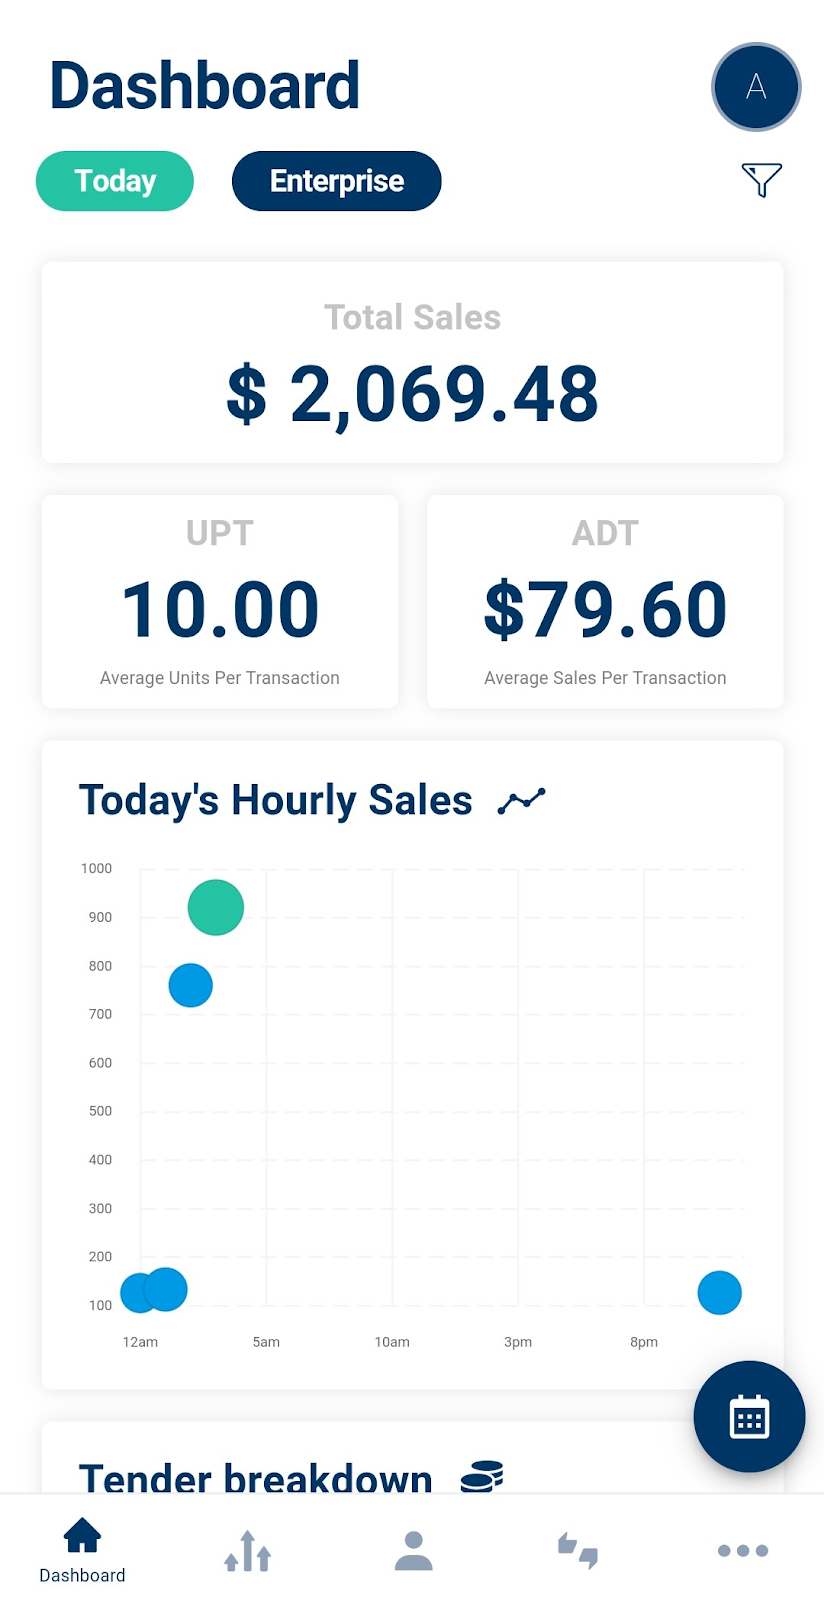
The dashboard of the application will be displayed soon after the user has logged in.
- Total Sales, Hourly Sales Graph, Tender Breakdown, Daily Sales Graph and Best Seller will be displayed on the dashboard which can be refreshed by swiping down the screen.
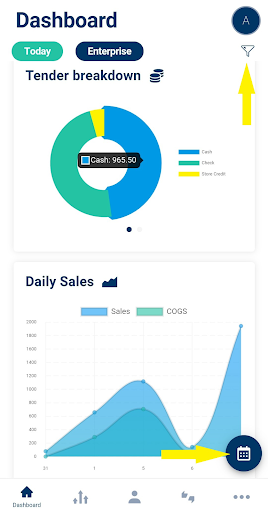
- Users will be able to view the graphical representation (Donut Chart) of Tender Breakdown

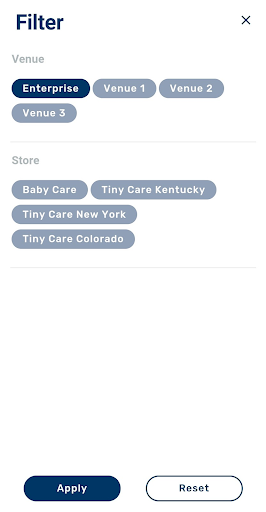
- To filter the sales analytics data by Venue or Store, navigate to the Filter icon on the top of the dashboard, select the filters and click Apply.
- The data can be also sorted by Today, Yesterday, This Month and Previous Month. Navigate to the 'Calendar' icon at the bottom of the screen.
Comments
Please sign in to leave a comment.