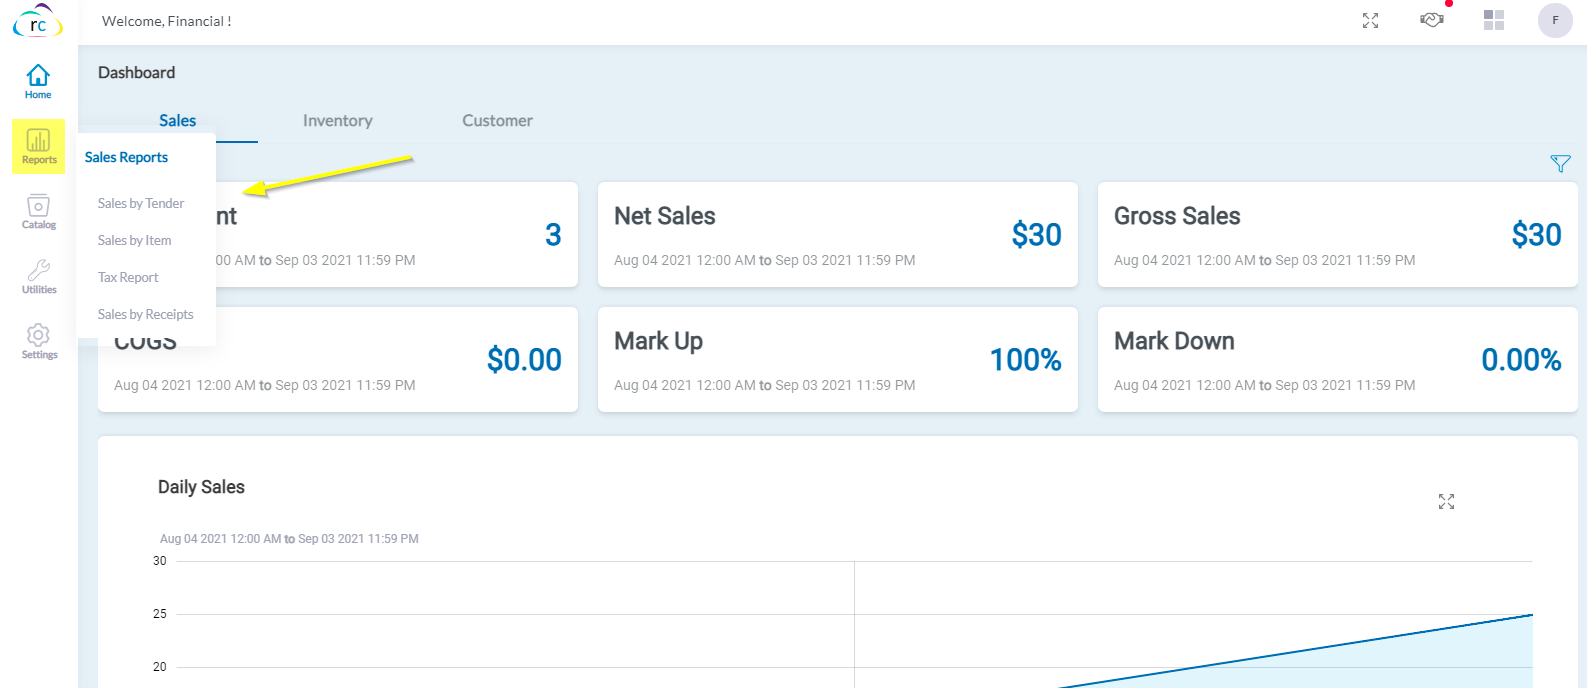
Reports are essential to check the progress of the businesses. The Console Portal has a diversified list of reports categorized under major domains of the business such as Sales, Inventory, and Production.
The Reports include:
- Run the Sales by Tender Report
- Run the Sales by Item Report
- Run the Tax Report
- Run the Sales by Receipt Report
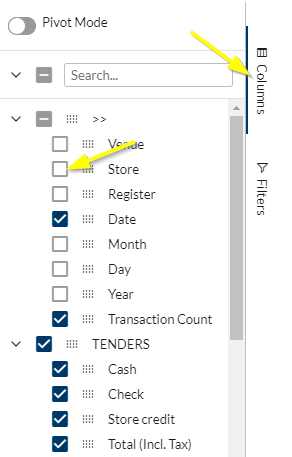
Add or Remove Columns in your Reports
You can add and remove columns in most reports to show more or less information than is shown by default.
Note: You can add a column to a report and print or export it, but you can’t save the edited report and reopen it later.
-
Open a report.
-
Click Columns. A drop-down list shows the columns that you can add or remove. The columns that are shown by default have a checkmark.
-
Check the columns you want to add. Uncheck the columns you want to remove.
Filter your Reports
You can filter reports to narrow down the information that is shown by default. For example, you can add a filter to show only sales for a specific sales channel, or Status, Tender Type, etc.
You can also add or remove columns in your reports. Any filters or edits that you apply are temporary.
-
Open a report.
-
Click Filters.
-
Select a Column
-
From the drop-down list, select the operator Contains, Not Contains, Equals, Not Equals, Starts With & Ends With.
-
In the filter box, type any value that you want to filter by.
If you want to filter Register by a value that is "California Register", and/or "Register 2" then select the operator Contains California RegisterAND/OR Contains Register 2
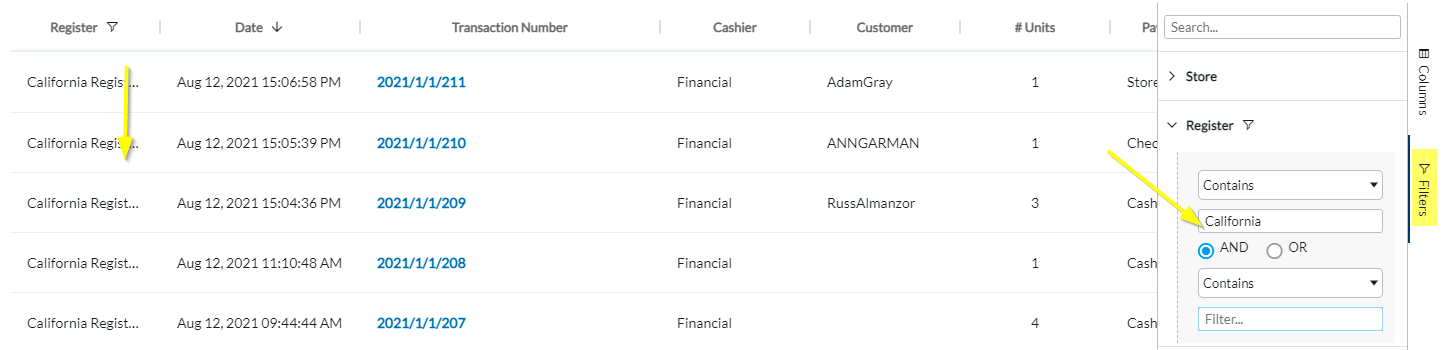
You can specify more than one value. If a filter uses the same name operator, then data is included in the report if any of the values match.
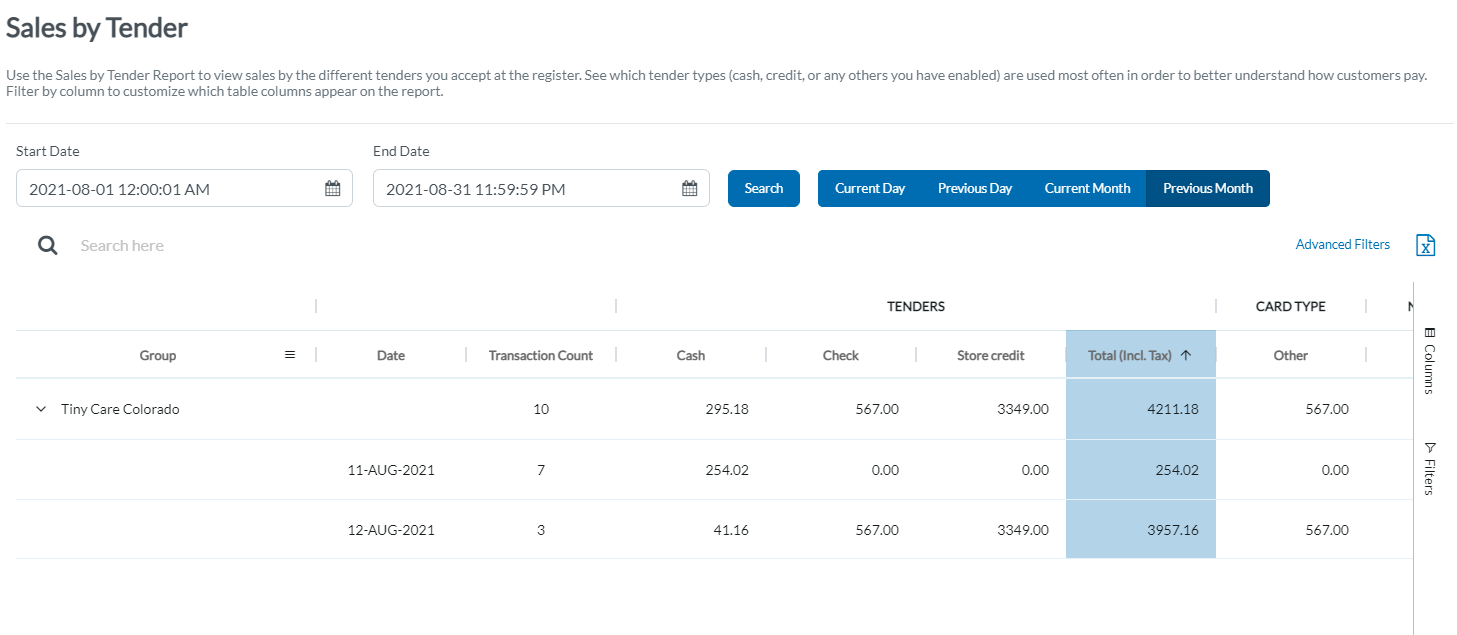
Sales by Tender
Use the Sales by Tender Report to view sales by the different tenders you accept at the register. See which tender types (cash, credit, or any others you have enabled) are used most often in order to better understand how customers pay. Filter by column to customize which table columns appear on the report.
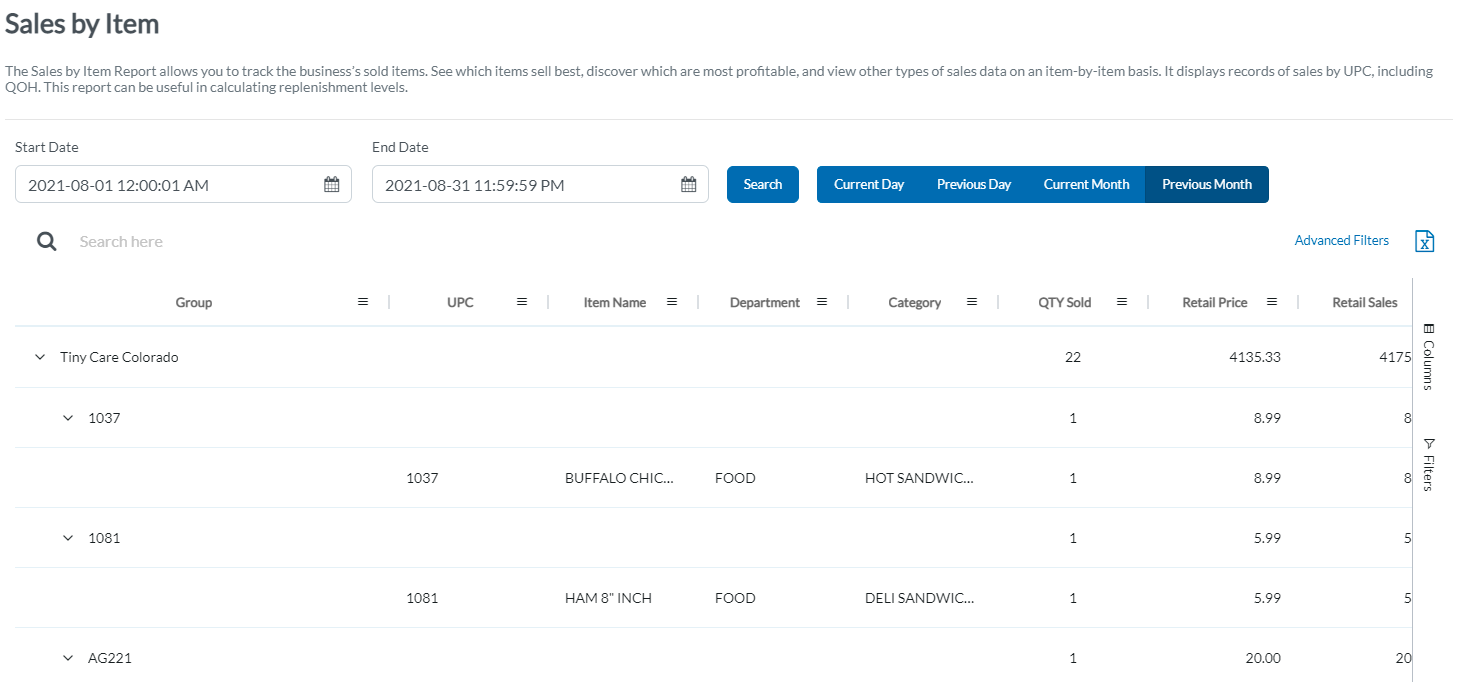
Sales by Item
The Sales by Item Report allows you to track the business’s sold items. See which items sell best, discover which are most profitable, and view other types of sales data on an item-by-item basis. It displays records of sales by UPC, including QOH. This report can be useful in calculating replenishment levels.
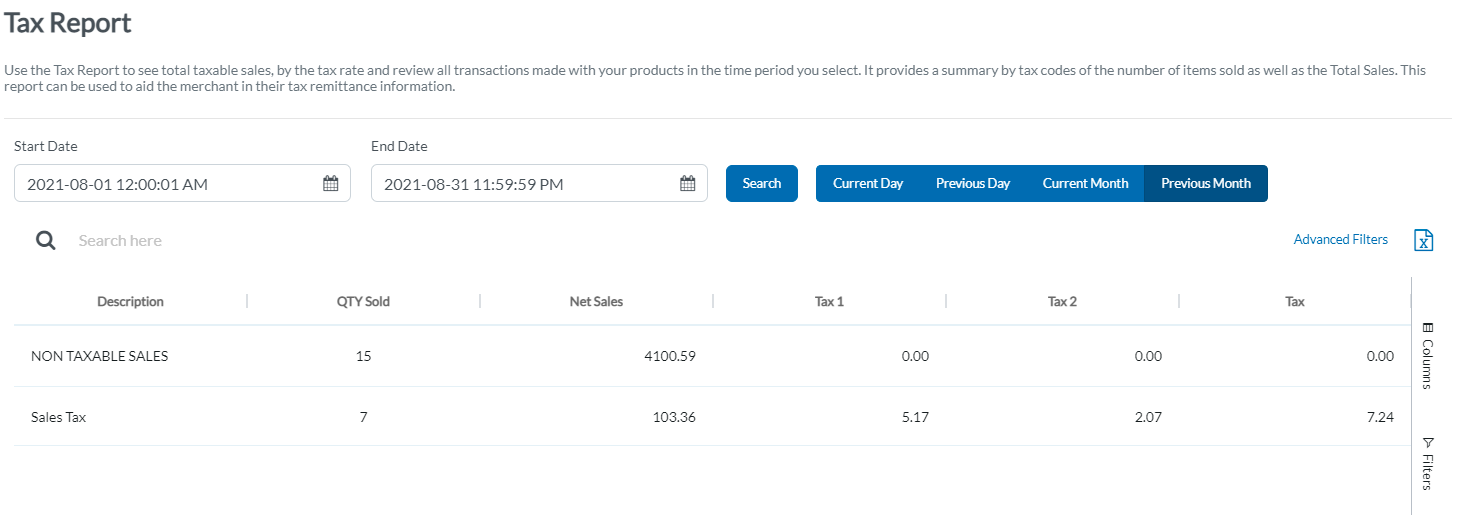
Tax Report
Use the Tax Report to see total taxable sales, by the tax rate and review all transactions made with your products in the time period you select. It provides a summary by tax codes of the number of items sold as well as the Total Sales. This report can be used to aid the merchant in their tax remittance information.
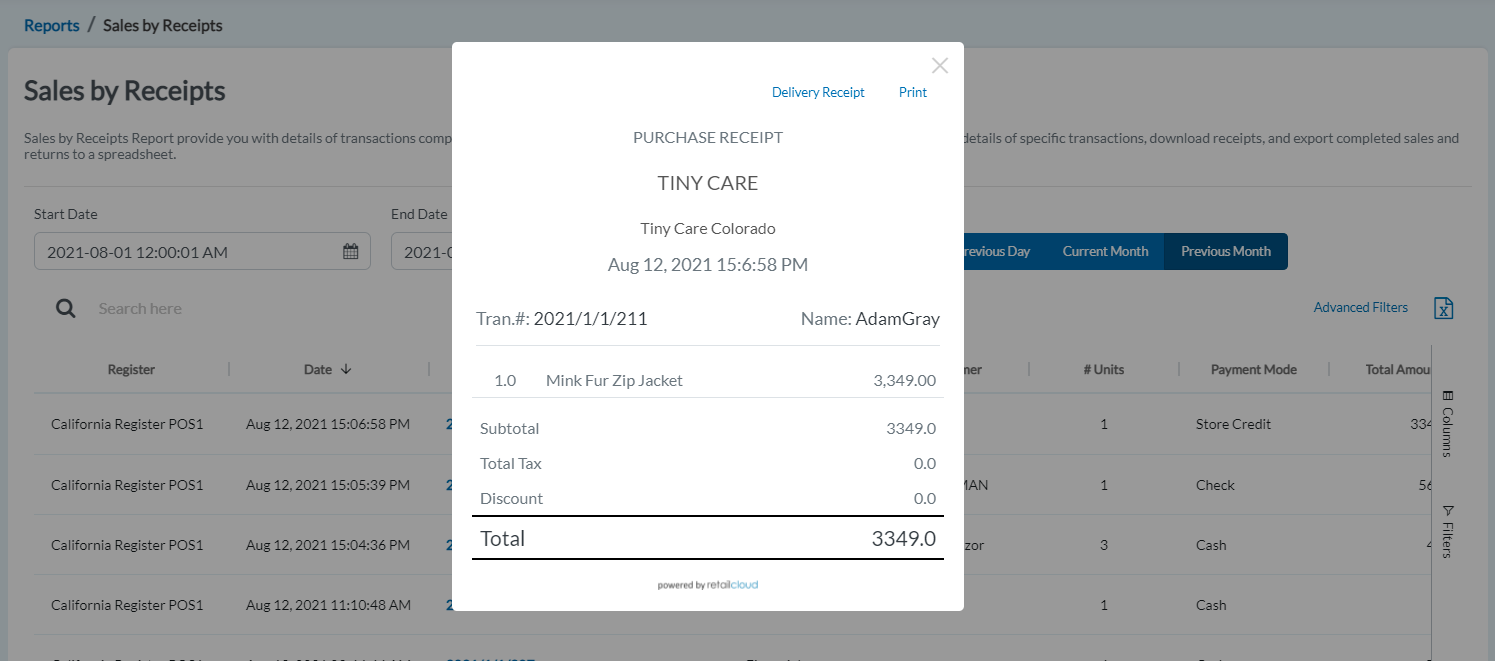
Sales by Receipts
Sales by Receipts Report provide you with details of transactions completed over a specified range of dates or transaction numbers. Use this report to view details of specific transactions, download receipts, and export completed sales and returns to a spreadsheet.
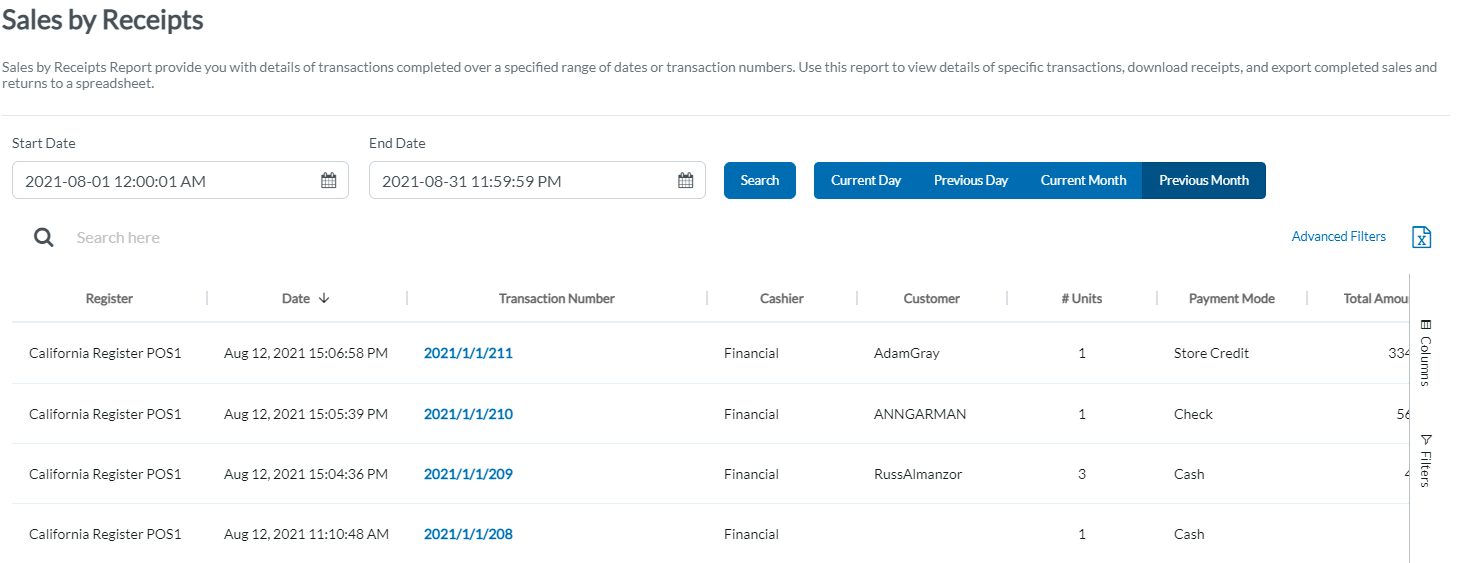
To view or print the transaction receipt, just click on the transaction receipt (blue highlighted).
Articles in this section
- Happy Path for Agents Training Merchants
- How to log into the Console?
- How to access Company settings on Console/6IX POS
- How to access the Register settings on Console
- How to customize the Receipt settings on Console/6IX POS
- How to create QuickPick on Console/6IX POS
- How to configure Tax Settings on Console
- How to manage Users on Console/6IX POS
- How to create Items on Console/6IX POS
- How to Import Items through Console?
Comments
Please sign in to leave a comment.