Reports are essential to check the progress of the businesses. The Console Portal has a diversified list of reports categorized under major domains of the restaurant such as Sales, Inventory, and Production.
The Reports include:
Sales Reports
- Check Details
- Sales By Tender
- Sales By Item
- Tax Report
- Category Report
- Sales By Employee
- Refund Report
Employee Reports
- Tip Report
- Time & Attendance Report
Sales By Promotions
- Discount Reports

Add or Remove Columns in your Reports
You can add and remove columns in most reports to show more or less information than is shown by default.
Note: You can add a column to a report and print or export it, but you can’t save the edited report and reopen it later.
-
Open a report.
-
Click Columns. A drop-down list shows the columns that you can add or remove. The columns that are shown by default have a checkmark.
-
Check the columns you want to add. Uncheck the columns you want to remove.

Filter your Reports
You can filter reports to narrow down the information that is shown by default. For example, you can add a filter to show only sales for a specific sales channel, or Status, Tender Type, etc.
You can also add or remove columns in your reports. Any filters or edits that you apply are temporary.
-
Open a report.
-
Click Filters.
-
Select a Column
-
From the drop-down list, select the operator Contains, Not Contains, Equals, Not Equals, Starts With & Ends With.
-
In the filter box, type any value that you want to filter by.
If you want to filter Status by a value that is "Initiated", and/or "Delivered" then select the operator Contains Initiated AND/OR Contains Delivered

You can specify more than one value. If a filter uses the same name operator, then data is included in the report if any of the values match.
Check Details
Check details report shows a list of all checks, the transaction number, date/time, and payment detail. Filters are available to hone in on specific information and date ranges.
This allows restaurants to easily learn about past guest experiences and provide personalized service.
Restaurants can view the following details: Check#, Transaction#,Order Status, Payment Status, Server, Date & Time of check, Ticket #, Guest Count, Comps, Net Sale, Tax, Bill Total, & Tips
Details
To filter by Order Mode, Tender Type or Server user selects by clicking the appropriate dropdown. You can also search by Transaction Number or Check.
Select the date range from the 4 preselected options (Current Day, Previous Day, Current Month, Previous Month) or select your own custom range using the beginning and ending date range calendars.
The user then can view the report or download the CSV file by clicking on this  icon
icon

To view, a transaction Receipt click on the blue transaction number,
Sales by Tender
Use the Sales by Tender Report to view sales by the different tenders you accept at the register. See which tender types (cash, credit, or any others you have enabled) are used most often in order to better understand how customers pay. Filter by column to customize which table columns appear on the report.

Expand Or Collapse Data
To expand or collapse column data, click on the arrow beside the value or click on the 3 horizontal bars beside the column and select Expand All - This will expand all the rows in the column.

The generated report contains the registers, date, and the sales amount in cash, credit, debit, check, gift, and totals for each register for the dates selected, as well as the further breakdown by card types. Note - the figures include sales tax collected on the transactions.
Sales By Item
The Sales by Item Report allows you to track the business’s sold items. See which items sell best, discover which are most profitable, and view other types of sales data on an item-by-item basis. It displays records of sales by UPC, including QOH. This report can be useful in calculating replenishment levels.

The Sales By Item report shows UPC level movement for a specified date range. It displays records of sales by UPC, including data on Quantity on Hand.
The "Quantity on Hand" reflected here is the inventory level as of the date the report is generated and not the inventory level as of the report ending date.
To filter by Venue, Store or Register user selects by clicking the appropriate dropdown.
The user enters the date range using the popup calendar for the Date From and Date To.
Tax Report
Use the Tax Report to see total taxable sales, by the tax rate and review all transactions made with your products in the time period you select. It provides a summary by tax codes of the number of items sold as well as the Total Sales. This report can be used to aid the merchant in their tax remittance information.
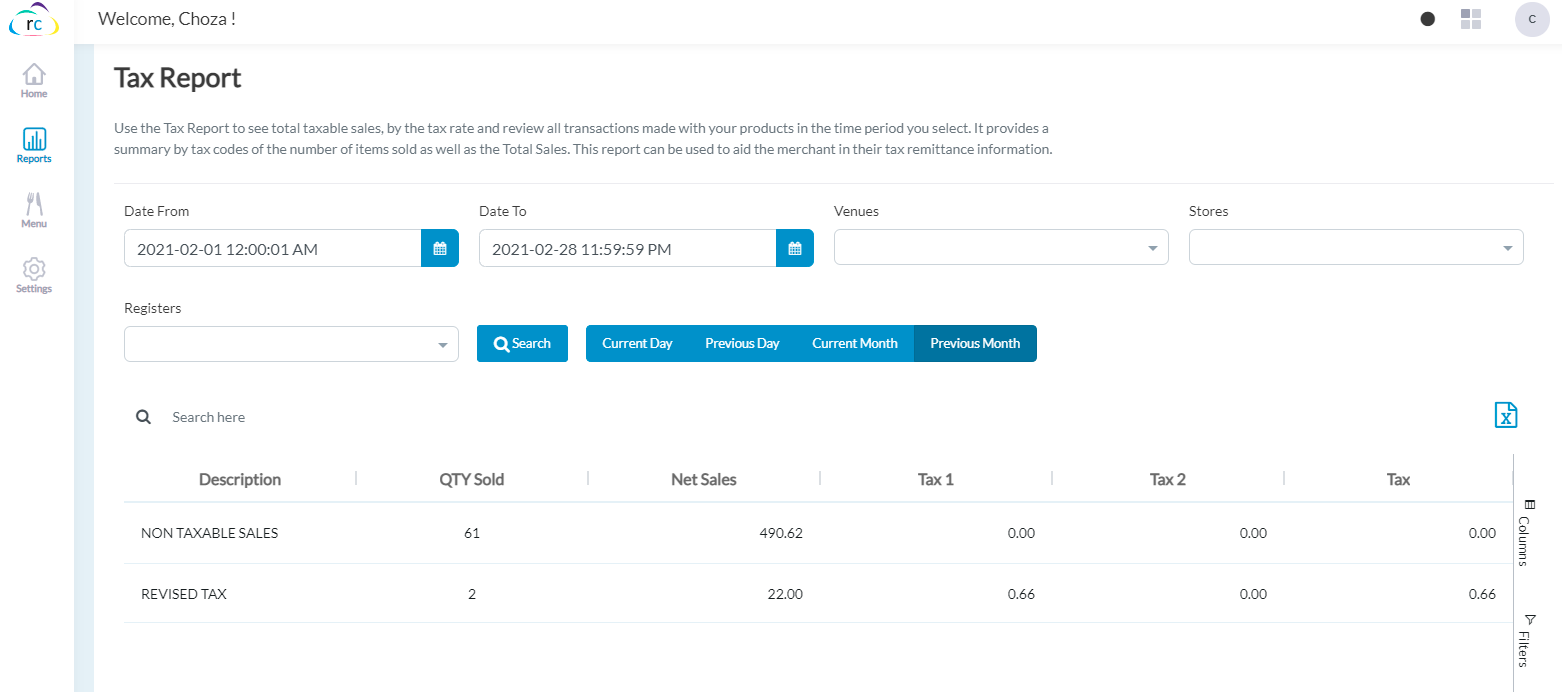
The user provides details and generates a Tax Report. The user specifies the report by the Venue, Store, Register, and then provides the date range which the sales are to be reported.
The user then can view the report or download the CSV file. The generated report provides the description, QYT Sold, net sales, tax 1, and tax 2 & Tax.
Some municipal jurisdictions support two tax rates for certain products (typically liquor tobacco etc), or as in the case of New York City, there are state and local taxes of which local taxes are waived during one week of the year. This allows the system administrator to manage the two rate tables if needed. The rates are calculated linearly or they can be compounded if required.
For example, suppose an item is sold for $100 and the tax rates are 10% and 2%. If linear the tax would be calculated as tax =($100 * (10% +2%))= $12 if compounded it would be tax =((($100*10%)+100)*2%)-100)=12.20.
Sales by Category
Sales by Category Report measures the total revenue a single category gains over a period of time, allowing your team to compare sales between different categories.

To filter by Venue, Store or Register user selects by clicking the appropriate dropdown.
Select the date range from the 4 preselected options (Current Day, Previous Day, Current Month, Previous Month) or select your own custom range using the beginning and ending date range calendars.
The user then can view the report or download the CSV file by clicking on this icon.
The generated report provides the #Sold, #Transaction, Sales, Tax, COGS, Margin, Margin%, ADS, Supplier, and Item meta.
Refund Report
This report provides information about refund transactions by reason code. Use it to monitor the percentage of refunds.
Review your activity at similar type stores to see if an unusual refund activity is occurring, you can do this by running the report and consolidating by venue or store. You may want to review your refund policy if this number is excessive. Some customers elect to not offer cash refunds and only provide them with gift cards.
You may also elect to require that all transactions be verified against original sales receipts if you are concerned about the validity of refunds.

The user provides details and generates a refund sales report.
The user then can generate the report or download the CSV file. The generated report provides the store, refund reason, the number of refund transactions, the total refund amount.
Employee Reports
Tip Report
This report provides information about transactions that had Tip added to them. It shows the Transaction number, Transaction Amount, Date, Register, Server, Tip Amount, and Total per Transaction.

The user provides criteria and specifies the report by date range. The user then can generate the report, download the CSV file.
Sales By Employee
Sales by Employee Report provides detailed sales information by employees. The report details the number of sales, the total dollar amount of the sales, the number of items sold/returned, and more. The report is helpful for merchants that have multiple salespeople help a customer, as it gives the employees recognition for the sale.

Discount Report
Discount Report provides information about items that were discounted on an item level. Use it to monitor the percentage of items that are sold at a discount and the discount codes that were used.

This report provides information about items that were discounted on an item level. Use it to monitor the percentage of items that are sold at a discount and the discount codes that were used. The Discount report also displays total discount amounts.
Check the Discounted Sales amount against Cost of Good Sold to make sure discounts are not costing you money.
Time & Attendance Report
This report provides you with a record of the number of hours where employees were clocked in, it can provide details for a date range or by on a daily basis.

Run this report periodically with the "Only Forced entry" flag enabled to see if you have any potential issues of employees not using the clock in/out feature or any potential abuses of supervisors modifying time stamps.
By selecting Only Forced Entries the report will show all time that has been edited from the original clock in or out.
To filter the report by date for the associated date range check the Display Date detail box.
Any combination of filters can be used to return desired results. The user then clicks the Search button and is given a report.
The user is also given the option to download a CSV file. When a report is generated, the user can see the Store, Employee name, Date, Start Time, End Time in the hours: minutes format of when the employee clocked in and out.
Articles in this section
- SuiteSpot Retail Merchandise Changes in Restaurant Portal
- Setup Gift Card Processor from Settings
- Discounts in Restaurant Portal
- Warehouse in Restaurant Portal
- Register in Restaurant Portal
- Venue in Restaurant Portal
- Venue Wizard in SuiteSpot
- Order Report and Kitchen Prep. Report Export
- CRM in Restaurant Portal
- Auths in SuiteSpot
Comments
Please sign in to leave a comment.